Evaluate and Pre-Process Sequencing Reads (Workflow Tutorial)
|
| The iPlant App Store is currently being restructured, and apps are being moved to an HPC environment. During this transition, users may occasionally be unable to locate or use apps that are listed in our tutorials. In many cases, these apps can be located by searching them using the search bar at the top of the Apps window in the DE. To increase the chance for search success, try not searching the entire app name and version number but only the portion that refers to the app's function or origin (e.g. 'SOAPdenovo' instead of 'SOAPdenovo-Trans 1.01'). In critical cases, please report your concern to the iPlant Ask forum or to support@iplantcollaborative.org. Thank you for your patience. |


Introduction and overview
Author: Roger A. Barthelson (rogerab at email.arizona.edu) / iPlant Collaborative, BIO5 Institute, University of Arizona
Goal
The goal of this tutorial is to become familiar with a commonly used procedure to clean and filter Illumina reads using tools (apps) in the iPlant Discovery Environment (DE).
The clean-up workflow tutorial will take users through the following operations:
- Evaluate the quality of reads in a set of sequence files (app: FastQC 0.10.1 (multi-file))
- Remove adapter sequences (app: Scythe-adapter-trimming)
- Filter the sequences by their quality (app: Sickle-quality-based-trimming)
- Re-evaluate the cleaned reads (app: FastQC 0.10.1 (multi-file))
- Evaluate the cleaned reads using a different method (app: Prinseq-Graph-noPCA evaluate reads)
Rationale and Background
Adapters and Barcodes Next-generation sequence data often arrive in raw form and may require some pre-processing prior to utilizing them in analyses. Frequently, sequences are labeled with short "barcode" sequences to distinguish independent sequence samples and/or group sequences according to the experiment they are associated with. The reads may also contain adapter or primer sequences that were used for a specific sequencing protocol. Barcode, adapter and/or primer sequences need to be removed prior to analyzing sequence reads. This may have been done automatically by the sequencing facility prior to handing the data off. Alternatively, the iPlant DE offers apps to pre-process sequences (e.g., Sabre for de-multiplexing reads, and Scythe for removing primer/adapter sequences). Consult your sequencing service to determine whether your sequences contain any primers/adapters/barcodes. If so, request a list of the respective sequences. Errors in de-convoluting barcodes can completely invalidate an experiment by affecting any or all stages of the data analysis.
Quality It is critically important to ensure that sequence data is of high quality. Each sequence run will generate a certain amount of low-quality reads depending on factors that include how mRNA and cDNAs were prepared prior to sequencing, the reagents used in the sequencing prep, and the specific run conditions on that specific day. The DE applications Sickle-quality-based-trimming, Pre-Process Reads, FASTX quality filter, and FastQC 0.10.0 are designed to filter out any low-quality reads and to identify biases and quality issues that may impact the analysis. The transcript and RNA-Seq data used in this tutorial were treated accordingly.
Additional Resources
- Visit this page for a quick overview over additional read pre-processing apps and tools. (Page may require login with an iPlant account.)
Prerequisites
- An iPlant account. (Register for an iPlant account at user.iplantcollaborative.org.)
- The DE Quick Start tutorial provides an introduction to basic DE functionality and navigation.
Test data
This tutorial uses Rhodobacter sphaeroides Illumina sequencing data that are stored in the Data Store in the iPlant Discovery Environment. They were downloaded from the GAGE project, which, in turn, retrieved them from the NCBI Sequence Read Archive (SRA) to test genome assembly methods. For the tutorial users will be directed to these data in the iPlant Data Store following this path: Community Data > iplant_training > read_cleanup > sampledata.
Results (Selected Screen Captures for Each Section)
 Input:
 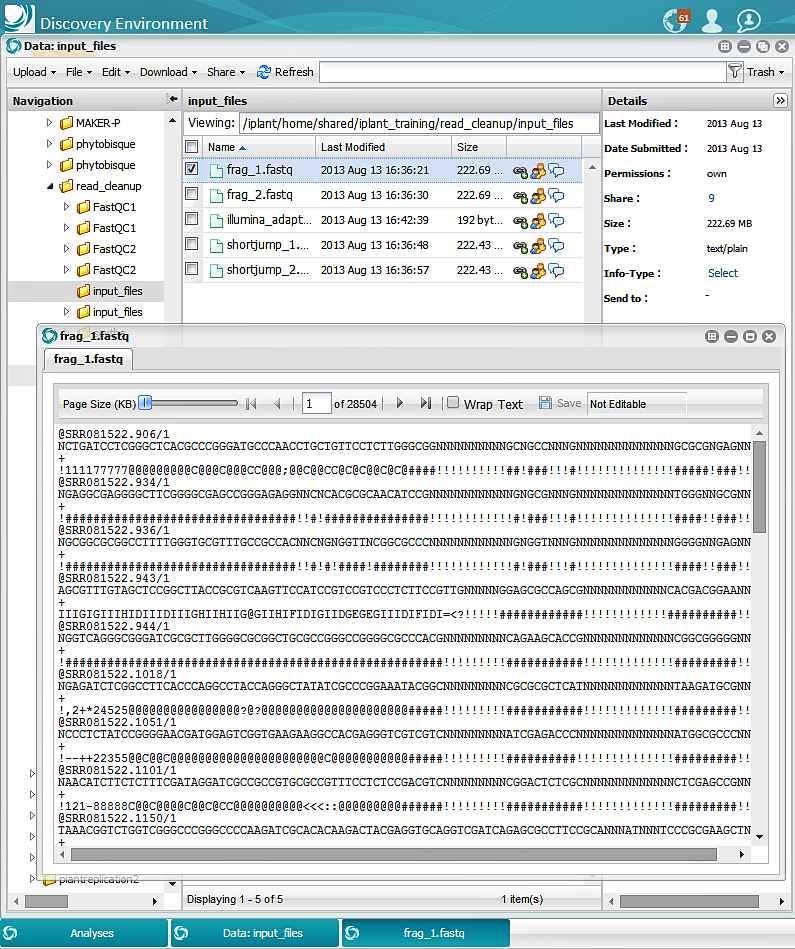 FastQC:
  Scythe:
  Sickle:
  FastQC:
  Prinseq_Graph:
Workflow
Operation 1: Evaluate read quality (app: FastQC 0.10.1 (multi-file))
The FastQC 0.10.1 (multi-file) app is used to evaluate the quality and content of sequence reads. (Basic documentation: https://pods.iplantcollaborative.org/wiki/display/DEapps/FastQC)
- Log into the Discovery Environment.
- Open FastQC 0.10.1 (multi-file) (Apps > Public Apps > NGS > QC and Processing > FastQC > FastQC 0.10.1 (multi-file)).
- Name your analysis.
- Click on "Select input data;" enter your sequence data file into Select input data.
- To analyze the sample data, enter all 4 sequence read files (.fastq) provided in Community Data > iplant_training > read_cleanup > sampledata.
- Launch the analysis.
- Once the analysis is completed (approx. 10 min. with the sample data), click on "Analysis," and then click on the analysis name to open the output folder.
- Examine the results:
- Within the output job file, there should be one directory for each of the original read files entered into the app. For the 4 test data files there should be four directories, each with 3 files and 2 folders that contain the information to build a web page listing comprehensive information on the sequence read files.
- Most of the evaluation information is provided in graphical formats in "Images" sub-directories. They hold .png files that depict the graphs produced during the analyses and that can be viewed directly in the DE by clicking on the file names.
- For a comprehensive comparison of the output data, download (using Simple download) the zipped output file to the desktop. (If the download takes to long or you only wish to examine specific files you can open them in the "Images" directories in the DE.)
- Examine the results for each of the four sequence read sets analyzed by opening the webpages (fastqc.report.html files) for each of them.
- Also examine the .png files in the Images directories.
- Notice that the data quality differs from read set to read set. Some sets have better scores at the longer lengths ("Per base quality"). Some sets may lose a significant portion of the total reads by using a high cutoff score ("per-sequence-quality"). The quality of a sequence varies with the position of the assessed units in the sequence ("Per base sequence content, Kmer content").
- Adapters: Following your analysis, determine whether the read sets are likely to show indication for being contaminated with adapter sequences. (For arguments sake, we will treat the sequence as if it is contaminated with adapters, and treat it in Operation #2 with Scythe to remove these adapters. However, see the Further Considerations section on the bottom for further deliberations on how to interpret the FastQC analysis results.)
- Read Quality: Following your analysis, estimate a reasonable cutoff setting for the quality scores for each sequence read file. (You will be using 12 and 15 when treating the read sets with Sickle in Operation #3, below. However, see the Further Considerations section on the bottom for further deliberations on how to interpret the FastQC analysis results.)
Operation 2: Remove adapter sequences (app: Scythe-0.991)
The Scythe-adapter-trimming app identifies adapter or primer sequences in your reads and removes them, using a fasta file of expected adapter/primer sequences. Ideally these expected sequences should be a comprehensive list of the primers and adapters used in preparing the sequencing library. If you aren’t sure, then a comprehensive file of a lot of different adapters and primers that might be used could be appropriate, but the settings should be adjusted to reduce the chance of randomly cutting real, organism-specific sequence. For the tutorial we use a large file of Illumina primer and adapter sequences, representing the most commonly expected contaminants from preparation of Illumina sequencing libraries. (Basic documentation: https://pods.iplantcollaborative.org/wiki/display/DEapps/Scythe-adapter-trimming)
- Open the Scythe-0.991 app
- Name your analysis.
- Click on the "Settings" tab.
- Enter the appropriate fasta-formatted “Adapter file.” (For the sample data enter "illumina_adapters.fa" at Community Data > iplant_training > read_cleanup > sampledata > illumina_adapters.fa.)
- As “Input file” enter a fastq-formatted sequence file. (Use one of the sample sequence files at Community Data > iplant_training > read_cleanup > sampledata.)
- Enter a unique name for the "Output file."
- Click on the "Options" tab.
- As "Quality format" enter "sanger." (Click on the "i" button to see the choices available. Acceptable formats for fastq files are "solexa," "illumina," or "sanger." The default setting for the app is “illumina,” but even Illumina sequences are predominantly presented in sanger format.)
- Enter an appropriate "Minimum match" cut-off. (For the sample data enter "10." With sequences of your own you may have to experiment to identify the optimal setting.)
- Enter a name for the "matches file" if you wish to monitor the matches Scythe will find. (Retaining matches provides a good way to judge the level of primer contamination of the sequences.)
- Enter an appropriate value for "Prior," smaller values establish stronger matching requirements. (For the sample data enter “0.005.” For your own data you may want to experiment to identify the optimal setting.)
- Click "Launch Analysis."
- Repeat the Scythe trimming procedure with the other 3 .fq sequence files.
- Once an analysis is completed (approx. 5 min. with the sample data), click on "Analysis," and then click on the analysis name to open the output folder.
- Examine the results:
- The file size of the matches files are with 2% - 2.5% of the .fq output files at a normal level and don't indicate major contamination. This confirms the FastQC results that suggested some contamination, but not necessarily a major issue.
Operation 3: Filter sequences by quality (app: Sickle-quality-based-trimming)
The Sickle-quality-based-trimming app is used to trim and filter FastQ files based on quality values. It is best used with sequences that have already been trimmed of adapters, primer sequences, or other extraneous sequences. Sickle works with both, paired or single reads. However, for paired-end sequence files, Sickle (as other quality-based trimmers) may break pairing for some reads. Sickle automatically monitors this and moves orphaned reads into a file of single reads. Also, if the sequence file is to be used for assembly with an application that uses read correction (e.g. AllpathsLG) or kmer analysis, results may be better without quality-based trimming or with-less stringent trimming. (Basic documentation: https://pods.iplantcollaborative.org/wiki/display/DEapps/Sickle-quality-based-trimming)
- Open the Sickle-quality-based-trimming_version_1.0 app
- Name your analysis.
- Click on the "Settings" tab.
- Select the appropriate sequence type. (For the sample data select "Paired.")
- Enter the first/only sequence reads file into “Reads 1.” (The .fq sample data file ending in "_1.fq" at Community Data > iplant_training > read_cleanup > scythe_output_from_sampledata)
- If your data consists of paired reads, enter the second of the paired sequence files into “Reads 2.” (The .fq sample data file ending in "_2.fq" at Community Data > iplant_training > read_cleanup > scythe_output_from_sampledata)
- Provide a unique "Output file 1" name.
- Provide a name for "Output file 2 (for pairs)."
- Provide a name for the "Single Read Output" file. (Single reads result from orphaned reads formed by the removal of low-quality reads from pairs.)
- Click on the "Options" tab.
- As "Quality format" enter "sanger." (Click on the "i" button to see the choices available. Acceptable formats for fastq files are "solexa," "illumina," or "sanger." The default setting for the app is “illumina,” but even Illumina sequences are predominantly presented in sanger format.)
- Enter an appropriate "Quality Threshold" as determined by an FastQC or equivalent assessment method. (For the sample data enter "15" for for the "fragSC" sample data and "12" for the "shrtjmpSC" sample data.)
- Enter an appropriate "Minimum length" for sequences to be retained. (For the sample data enter "40.")
- Checking the check box for "No N's" would establish more stringent conditions as it removes all reads that contain N’s in the sequence. (For the sample data check the "No N's" check box.)
- Click "Launch Analysis."
- Repeat the Sickle trimming/filtering procedure with the two "shrtjmpSC" sequence files in Community Data > iplant_training > read_cleanup > scythe_output_from_sampledata. (Set "Options" > "Quality threshold" to "12")
- Once an analysis is completed (approx. 5 min. with the sample data), click on "Analyses," and then click on the analysis name to open the output folder.
- Examine the results:
- Comparing the output for the fragSC and shrtSC sequence samples, respectively, it is apparent that Sickle generated some single reads from both paired read files. This indicates issues that led to the removal of sequences due to the presence of Ns. Alternatively, some sequences may have been of poor quality, requiring large portions to be trimmed, and resulting in sequences that were of less than the "Minimum length" threshold set. Unless both reads of a pair were removed, either of these operations would have generated single reads.
Operation 4: Reevaluate read-quality of the cleaned reads (app: FastQC 0.10.1 (multi-file))
- Run FastQC on the output files of the read files that were treated with Scythe and Sickle to examine the improvement in quality. Enter all 6 Sickle-quality-based-trimming output files at once (2 treatments, 3 files each: _Out_singles, _Out, _Out_pairs). (Sample data at Community Data > iplant_training > read_cleanup > sickle_output_from_sampledata)
- Analyzing the results notice that none of the quality values go below the quality set in Sickle-quality-based-trimming.
- Looking at the Summary files it becomes apparent that the only areas of concern for the reads are related to the sequence content, e.g. per base sequence content, Over-represented sequences, and Kmer Content. This problem may be a reflection of adapter or primer sequences on the 5' end, where some of highest deviation in sequence content occurs. Scythe does not trim 5' ends. (Fastx trimmer does trim 5' ends.) If there is a strong indication that there are residual contaminants on the 5' end, then 5'-trimming would be a good option to try. On the other hand, further trimming should not be done without a strong indication that it is needed. To trim the sequences "blindly" will significantly reduce the length of the reads available for assembly, potentially compromising the results. Testing additional trimming on some of the files resulted in decreased overall scores, so trimming the sample files further is not a viable option. The sequences used for the tutorial are from a relatively small bacterial genome and the coverage is with 60X fairly high, so heavily represented sequences can be expected.
Operation 5: Use an alternative method to evaluate read-quality (app: Prinseq-Graph-noPCA evaluate reads)
Prinseq-Graph-noPCA determines sequence read quality and generates graphs that are used to assess read quality. (Basic documentation)
- Open Prinseq-Graph-noPCA evaluate reads (Public Apps > NGS > QC and Processing > Prinseq-Graph-noPCA evaluate reads)
- Name your analysis.
- Click on the "Prinseq-Graph-step1 - Settings" tab.
- Enter one of the fastq files already trimmed with Scythe and Sickle into the "Input sequence window." (E.g. shortjump_1.fq sample data at Community Data > iplant_training > read_cleanup > sickle_output_from_sampledata)
- Click on the "Prinseq-Graph-step2 - Options" tab.
- Select "Output format" "html."
- Click "Launch Analysis."
- Once an analysis is completed (approx. 30 min. with each sample sequence file.), click on "Analyses," and then click on the analysis name to open the output folder.
- Examine the results:
- For a more comprehensive analysis, download the output html file to the desktop, and open it in a browser.
- Notice that the Prinseq analysis provides information similar to what is given by FastQC. For the tutorial data there is some indication of over-represented sequences. Take a look specifically at the Tag Sequence Check section. For the tutorial data, it indicates that there is a very low likelihood that there is a tag or adapter sequence contaminating the reads. The reads should be ready for use in assembly or RNA-Seq studies.
Further considerations
An important aspect of read cleanup is the ability to recognize and identify flaws in the sequencing reads, so that the right tool(s) can be used to correct them. For example, the image from the FastQC evaluation (Operation 1 above) before trimming the reads (per_base_quality.png; displayed above) shows a graph (blue-ish) of the base number along the length of the read, and the average quality score at that base, along with range of deviation. The documentation for FastQC (http://www.bioinformatics.babraham.ac.uk/projects/fastqc/Help/) indicates that for this plot, the blue line represents the mean for each quality score; the red, vertical lines represent the medians, and the yellow boxes represent the inter-quantile ranges (25-75%). The error bars (black) indicate the 10% and 90% points. This plot shows for all sequences analyzed that a large portion of the reads are severely compromised in quality and show inter-quantile ranges well into the red zone of quality scores below 20. The mean for the last base is as low as 4 in a couple of the analyzed read sets.
To clean these reads one might choose the Sickle algorithm (Operation #2 above) with a quality threshold setting of 20. That high a setting however, would clip a significant portion of the reads to a length of 70 bases or less. This, in turn could cause problems by reducing the lengths of overlapping sequence stretches required to construct reasonably justifiable contigs. In deciding whether and how to clean up a sequences, users need to weigh the planned use of the reads and the number of sequence files available for that use (same genome assembly, or same sample in an RNA-Seq analysis). If the reads are planned to be used to assemble a genome and the number of reads available is low (e.g. 10x coverage), then one may prefer preserving more length and to throw out fewer reads. In this case, maybe a setting of 12 for the quality threshold may be used. Alternatively, if the reads are to be used for RNA-Seq analysis, and there are plenty of replicates in the experiment, then accuracy of the reads may be more important then length and number. In this case the threshold setting of 20 may be preferable.
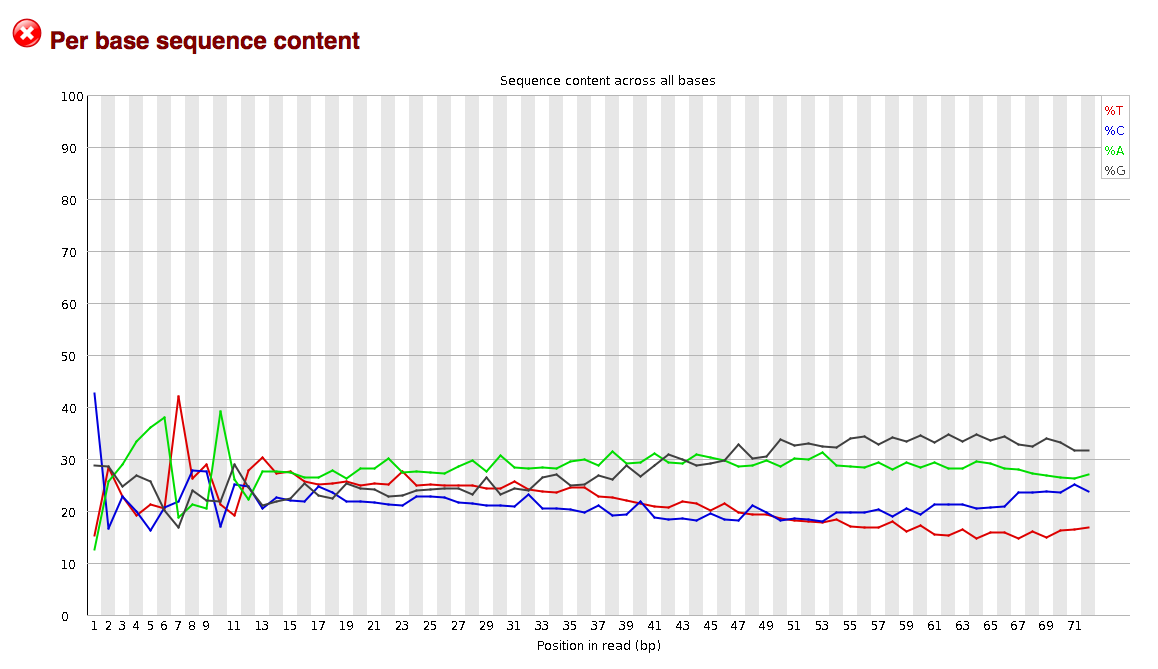
Another consideration when evaluating reads may be the degree to which they are contaminated with adapter sequences. This contamination may be seen in the per_base_sequence_content graphs. The graphs in the per_base_sequence_content.png display sequence content as function of position.
The sequence read data used in the examples above display no indication of adapter contamination as a randomly selected set of sequences from a genome or transcriptome can be expected to show largely flat percentages for each base across the length of the reads. If adapters were present the flat line would likely be distorted into a wavy line, indicating the presence of commonly duplicated sequences, such as adapters. This conclusion could then be corroborated by analyzing read kmer content, which can be seen in the “kmer_profiles.png” files.
If a set of sequence reads shows indication of adapter contamination, Scythe may be able to remove this contamination, provided it consists of either commonly used adapter sequence or a known primer sequence used in preparing the sample. Otherwise, if the contamination resists treatment with Scythe and Sickle, then trimming the first 10 to 12 bases from all reads may be in order; loss of sequence length may be better than having a large number of spurious assemblies created around a commonly occurring extraneous sequence.
 per_base_sequence_content (potential problem)
 kmer_profiles.png (potential problem)
The Prinseq-Graph results for the example read sets analyzed above does not indicate a specific set of tag sequences (“tagcheck.png”), neither. This corroborates the conlcusion of absence of adapter contamination for the four data set analyzed here. It can't rule out, however, that multiple tag sequences may overlap each other.
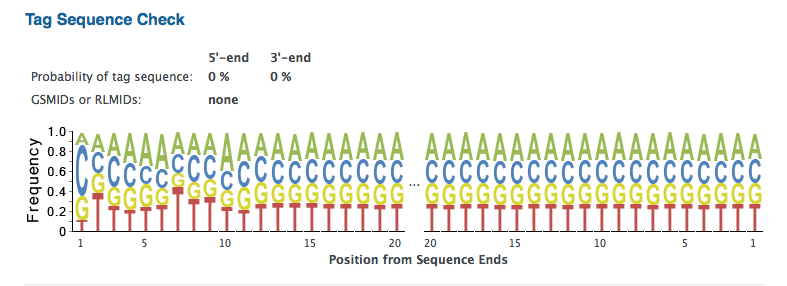 tagcheck.png (alright)
As shown in another example, a similar problem exists with sequence over-representation at the beginning of the reads (“per_base_sequence_content2.png”), but the kmer content indicates that there are heavily overrepresented whole sequences – start to finish (“Kmer_profile2.png”). Clipping of the beginning of the reads may not be appropriate, since these heavily represented sequences may be highly expressed sequences, or they may be an indication of over-amplification of the sample at some stage of preparation.