Demonstrate
Demonstrate
What is Demonstrate?
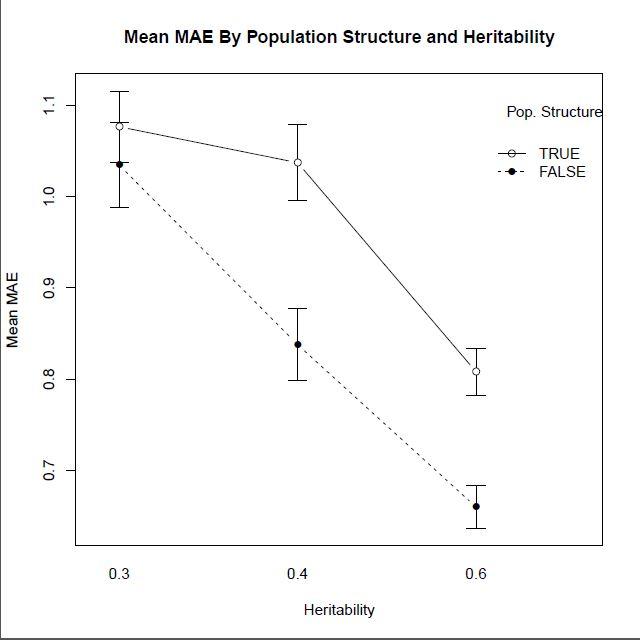
Demonstrate is the final step in the Validate known-truth pipeline for iPlant Collaborative. It produces a single data set from several Winnow results files as well as two graphics showing differences in a GWAS/QTL applications performance under varying heritability and population structure. Now included: Demonstrate2 provides further data visualization capabilities without being restricted by either heritability or population structure of data.
How to Get Started
Data with Heritability and Population Structure Specified
If you want to visualize differences in your data based on heritability or population structure, you'll want to use the original function Demonstrate. To run Demonstrate, type R on your terminal or command line to open the R console. From there use:
library(Demonstrate) If nothing happens, then you did it correctly! Now the Demonstrate package is loaded. Here are the options to run the function:
Demonstrate(dir, outputdir=NULL, settingsfile=NULL, make.AUC.plot=TRUE, AUC.plot.title="Mean AUC By Population Structure and Heritability", make.MAE.plot=TRUE, MAE.plot.title="Mean MAE By Population Structure and Heritability",herit.strings=list("_03_","_04_","_06_") ,herit.values=list(0.3,0.4,0.6),struct.strings=list("PheHasStruct","PheNPStruct"),struct.values=list(TRUE,FALSE))
In this function, dir represents the directory where all Winnow output is stored and outputdir represents the directory where output will be saved to; by default this is NULL and the input directory is used. settingsfile represents the .param file from Winnow and is set to NULL by deafult. If the .param file is given, settings from Winnow will be added to the graphs. These default values are based on the sample data found within this repository. Once run, the function will create two graphs on the mean absolute error (MAE) and area under the receiver operator curve (AUC) across varying levels of heritability and/or population structure. The graphs are in pdf format.
Other data from Winnow
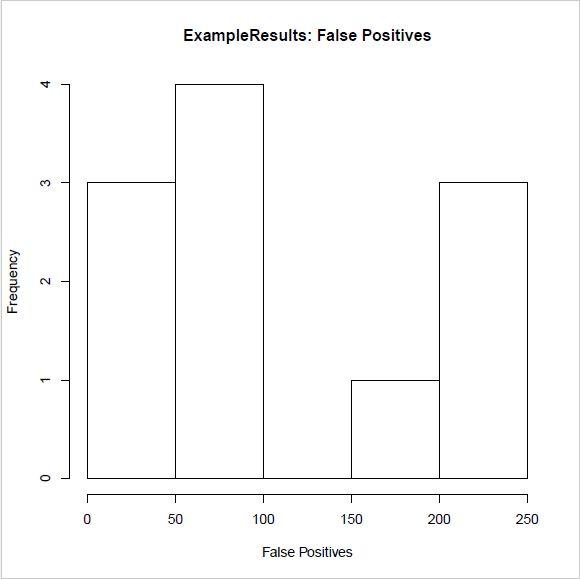
For other types of data, or if you're more interested in comparing GWAS tools than comparing data, you will want to use the Demonstrate2 function. Before running it though, you will need to include the function in your global environment:
source("<path to>/Demonstrate2.R")
Then run the function:
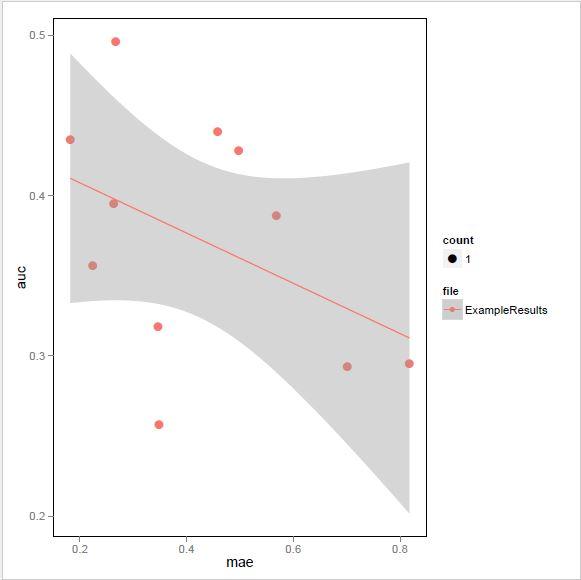
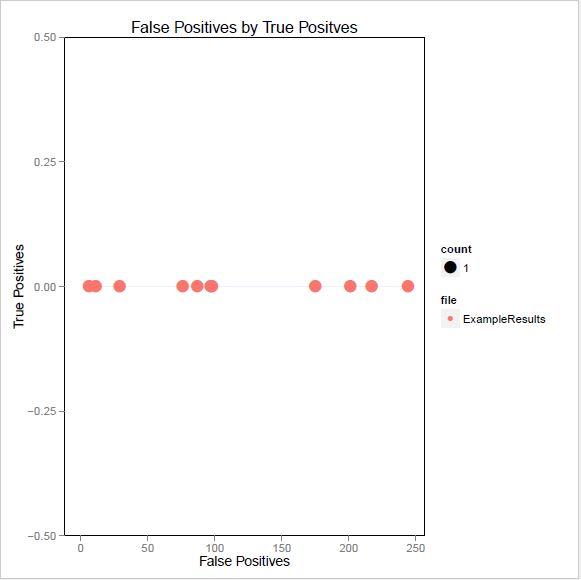
Demonstrate2(dir, outputdir=NULL, settingsfile=NULL, make.pos.plot=TRUE, pos.plot.title="True Positives by False Positives", make.error.plot=TRUE, error.plot.title="Plot of AUC by MAE", extra.plots=TRUE, AUC.axis.min=0, AUC.axis.max=1.0, MAE.axis.min=0, MAE.axis.max=2.0)
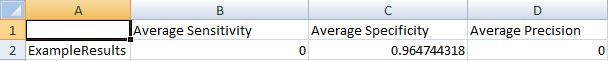
Assuming all outputs are kept, Demonstrate2 will output five files in total. First, two frequency histograms illustrating the distribution of both true and false positives (if multiple Winnow files were in the original directory, the pdf files will have multiple pages). Second, a .csv file detailing the average sensitivity, specificity, and precision of each
file. Finally, two plots based on true vs. false positives and mean absolute error vs. area under the curve will be produced. Demonstrate2 will color the points based on the file they came from, so you can compare multiple GWAS analysis results on the same plot.
Demonstrate With Python
The Python implementation of Demonstrate works similar to the original program and provides the same output. The most important difference is the syntax to run the program.
To see all of the possible options, type this command into the terminal/command line from the directory containing demonstrate.py:
python demonstrate.py --help
Required arguments
--verbose (or -v) to trigger verbose mode
--dir (or -d) which denotes the folder of input files (required)
--output (or -o) which denotes the folder to store the output. This is optional and the input folder will be used if this is not specified
--settings (or -s) which denotes the .param file from Winnow containing the settings used to be included on the output plots. This is optional and not used by default
demonstrate or demonstrate2 to specify which version of Demonstrate to use (required)
To run Demonstrate with only these settings; note the only 2 required settings are --dir and the mode
python demonstrate.py --verbose --dir ~/Documents/DemInputFiles --output ~/Documents/DemOutput --settings ~/Documents/DemInputFiles/winnowoutput.param demonstrate
python demonstrate.py --verbose --dir ~/Documents/Dem2InputFiles --output ~/Documents/Dem2Output --settings ~/Documents/Dem2InputFiles/winnowoutput.param demonstrate2
Extra Parameters
These have default settings but can be changed by adding the argument after the mode (e.g. after "demonstrate")
Demonstrate
--xauc (or -a) to exclude the AUC by Population Structure and Heritability plot (not set by default)
--auctitle (or -t) to specify the AUC plot title ("Mean AUC by Population Structure and Heritability" by default)
--xmae (or -m) to exclude the MAE by Population Structure and Heritability plot (not set by default)
--maetitle (or -y) to specify the MAE plot title ("Mean MAE by Population Structure and Heritability" by default)
--heritstring (or -r) to specify the heritability string found in the input data ("_03_","_04_","_06_" by default)
--heritvalue (or -l) to specify the heritability value found in the input data (0.3, 0.4, 0.6 by default)
--structstring (or -u) to secify the structure string found in the input data ("PheHasStruct", "PheNPStruct" by default)
--structvalue (or -p) to specify the structure value found in the input data (True, False by default)
Run Example (Including all plots)\
python demonstrate.py --verbose --dir ~/Documents/DemInputFiles --output ~/Documents/DemOutput --settings ~/Documents/DemInputFiles/winnowoutput.param demonstrate --auctitle AUC --maetitle MAE --heritstrig _03_ _04_ _06_ --heritvalue 0.3 0.4 0.6 --structstring PheHasStruct PheNPStruct --structvalue True False\
Demonstrate2
--xpos (or -q) to exclude the True Positives by False Positives plot (not set by default)
--postitle (or -i) to specify the True Positives by False Positives plot title ("True Positives by False Positives by default)
--xerror (or -e) to exclude the error plot (not set by default)
--errortitle (or -w) to specify the error plot title ("Plot of AUC by MAE" by default)
--extraplots (or -x) to exclude the extra plots (not set by default)
--aucmin (or -z) to specify minimum axis value for the AUC plot (0 by default)
--aucmax (or -b) to specify maximum axis value for the AUC plot (1.0 by default)
--maemin (or -n) to specify minimum axis value for the MAE plot (0 by default)
--maemax (or -c) to specify minimum axis value for the MAE plot (2.0 by default)
Run Example (Including all plots)
python demonstrate.py --verbose --dir ~/Documents/Dem2InputFiles --output ~/Documents/Dem2Output --settings ~/Documents/Dem2InputFiles/winnowoutput.param demonstrate2 --postitle TPbyFP --errortitle AUCbyMAE --aucmin 0 --aucmax 1.5 --maemin 0 --maemax 2.5
Further Information:
Example outputs:

This tool is still in development and we are testing it currently. If you notice any issues or have any comments we would greatly appreciate them!
Please contact us at labstapleton@gmail.com. Thank you for using our tools!